Frequency response data

de Houtwinkel

Member
Joined
Dec 3, 2023
Messages
20
Reaction score
57
Location
Logan, Utah
Hey all!

I'm wondering if any of you builders here have collected data on your ukes. And if so I'd love to see it, if you wanted to share. I'm beginning to make a database of not only my ukuleles, but others too.

I know there are many variables and dissimilarities with how everyone collects the data(type of material to tap the bridge, closeness from mic, etc) but it still would be relevant information.

Thanks!
 
Here is what I got on my last 2 tenors
Kahya body and western red cedar top

T(1,1)1214223.5
T(1,1)2441507
T(1,1)3495462.5
B(1,1)493.5458
Hey thank you so much, I appreciate that. Do you mind sharing the neck, fretboard, and bridge woods? As well as the brace type, and finish?
 
Once I did measure the frequency response using RTA software (i.e. graphical measurement of fundamental and harmonic peaks) of plucked strings on 2 ukuleles. One of them sounded a bit sour despite having decent intonation, and I was trying to figure out what was going on with that.

I just finished a soprano and I'm getting close on a tenor. I might set up the measuring rig and do those just for fun.
That would be great to see the data! I use the REW software myself for the ease of use.
 
I have two tenors here: (1) a Magic Fluke with spruce top that has a tone of 228 Hz (a little flat of A#3) when I tap the bridge.

(2) a tenor I'm making (not finished yet - it's assembled with strings but has a temporary plywood back so I can futz with the bracing). It has a western red cedar top. It has a tone of 211 Hz (sharp of G#3) when I tap the bridge. With this one, I have a low G string on it, and I'm finding that open G, especially G#, and A on the G string are pretty noticeably louder than other strings. That isn't surprising, but it's more noticeable on this one than when I play an A# vs other strings on the Magic Fluke.

Not sure if this is the sort of data you had in mind, but here it is. I haven't yet tracked down the string frequency response graphs I made for another uke, which I discussed in an earlier post. Will still look for that when I get a chance.
 
Here's an example of taking frequency response measurements for individual strings for a popular commercial soprano with ply soundboard (high G - orange, C- green, E-blue, and A - brown). The difference in peak heights for the fundamental tones (4 highest peaks on the left side) are probably mostly the difference in how hard I plucked the strings, so that's not significant. I was looking for the difference in height between the fundamental peak and subsequent harmonic peaks for each string, and also what multiples the harmonics were from the fundamental.

This was a very rough and ready test setup. I laid the ukuleles down on my couch with a pillow under the neck. I have a calibrated measurement mic that I set up on a boom mic stand pointing at the sound hole (perpendicular to the sound board, probably a couple inches away), ran the signal through a mixer and into my laptop sound card. I plucked each string individually and took a snapshot of frequency response using the RTA function of the REW software.

Something glitchy happened where the fundamental peaks for C, E, and A occurred a bit off from where they should have in Hz, while the high G was pretty close at 389 Hz. So this should be taken with a grain of salt. If I was doing this seriously, I would try to figure out what happened there. I'm pretty sure I tuned carefully before doing this, although it was a few years ago.

Flea all strings.JPG

I also did a similar set of measurements for a commercial concert scale uke with what appears to be a solid western red cedar top. In this case, the 2nd peaks were not as attenuated as the fundamental peaks, and some of the third peaks were almost as strong as the fundamentals. Same caveat applies about the C, E, and A fundamental peaks not landing in the right spots.

Luna all strings.JPG
 
Here's an example of taking frequency response measurements for individual strings for a popular commercial soprano with ply soundboard (high G - orange, C- green, E-blue, and A - brown). The difference in peak heights for the fundamental tones (4 highest peaks on the left side) are probably mostly the difference in how hard I plucked the strings, so that's not significant. I was looking for the difference in height between the fundamental peak and subsequent harmonic peaks for each string, and also what multiples the harmonics were from the fundamental.

This was a very rough and ready test setup. I laid the ukuleles down on my couch with a pillow under the neck. I have a calibrated measurement mic that I set up on a boom mic stand pointing at the sound hole (perpendicular to the sound board, probably a couple inches away), ran the signal through a mixer and into my laptop sound card. I plucked each string individually and took a snapshot of frequency response using the RTA function of the REW software.

Something glitchy happened where the fundamental peaks for C, E, and A occurred a bit off from where they should have in Hz, while the high G was pretty close at 389 Hz. So this should be taken with a grain of salt. If I was doing this seriously, I would try to figure out what happened there. I'm pretty sure I tuned carefully before doing this, although it was a few years ago.

View attachment 162650

I also did a similar set of measurements for a commercial concert scale uke with what appears to be a solid western red cedar top. In this case, the 2nd peaks were not as attenuated as the fundamental peaks, and some of the third peaks were almost as strong as the fundamentals. Same caveat applies about the C, E, and A fundamental peaks not landing in the right spots.

View attachment 162655
Thanks for sharing!

What I'm mainly looking for is data taken from the instrument using the Gore/Gilet method by tapping on the bridge, and collecting the coupled air modes/monoploes...main air resonance, top and back to be precise. I don't think plucked strings would be a precise measurement to add to this data collection as it would only be measuring the vibrating string and not the modes from the body.

I'm building a database so that this can be shared publicly with other builders for reference. There isn't a whole lot of data out there for ukes as there are for acoustic guitars yet. Mainly I would like the brand, model(size), tonewoods used, and brace pattern along with the data.
 
I didn't think that it was what you were looking for, but I think it's an interesting and possibly mildly useful thing that can be done to show why ukuleles sound different from one another. Maybe/maybe not why one sounds better than another.

I have a bit of a background in loudspeaker building and also home and pro sound audio. When I started playing around with ukuleles I wondered if there was an idealized frequency response that made a ukulele sound like a ukulele and not like a classical guitar (for example). Searching around, I didn't find much on that. But I still think it's an interesting question....
 
I still do appreciate your reply!

Yeah I personally don't think this data will reflect which ukulele is "better"(sound is subjective), but the frequency response does give you a good idea of the quality of the acoustics.

It's helpful for me when determining the tone I'm setting out to seek for a particular client. I think the science is starting to change acoustic instruments, albeit mainly from small boutique builders.
 
I appreciate you taking the time for this. I have been refining my archtop ukulele design for a while and have just start using the IStroboSoft tools on my IPhone to take these measurements.
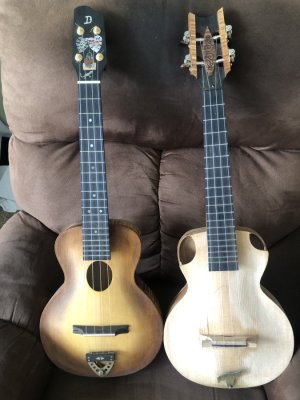
For the tenor on the right;
Body Resonance 218.4 Hz
Top Resonance approximately 400 Hz
Back Resonance approximately 550 Hz

On the left;
Body Resonance 179.2
Top Resonance approximately 400 Hz
Back Resonance approximately 630 Hz

The big difference between these two tenors is the shape and position of the sound holes. And as shown by the data, the timbre of the one on the left is a bit darker than the other. I think this kind of technology opens up a whole new area for adjusting the sound of our instruments.
Brad
 

Attachments

  • IMG_5593.jpeg
    IMG_5593.jpeg
    109.7 KB · Views: 10
I appreciate you taking the time for this. I have been refining my archtop ukulele design for a while and have just start using the IStroboSoft tools on my IPhone to take these measurements.
For the tenor on the right;
Body Resonance 218.4 Hz
Top Resonance approximately 400 Hz
Back Resonance approximately 550 Hz

On the left;
Body Resonance 179.2
Top Resonance approximately 400 Hz
Back Resonance approximately 630 Hz

The big difference between these two tenors is the shape and position of the sound holes. And as shown by the data, the timbre of the one on the left is a bit darker than the other. I think this kind of technology opens up a whole new area for adjusting the sound of our instruments.
Brad
It's definitely something that will take lots of time. I think once I have a spreadsheet set with certain parameters that I can share on Google or something, then it will be easier for people to input/collect the data. This tech has done wonders for my instruments, and the ability to really hone in on a tone or sound my clients want is great.

I think certainly we need to establish a "set standard" too. Which speaking of, I'm not familiar with IStrobosoft....how are you getting this data from your instrument? Thanks again for replying!
 
Top Bottom